04 · Backend · Financial data
Portfolio Risk Analytics
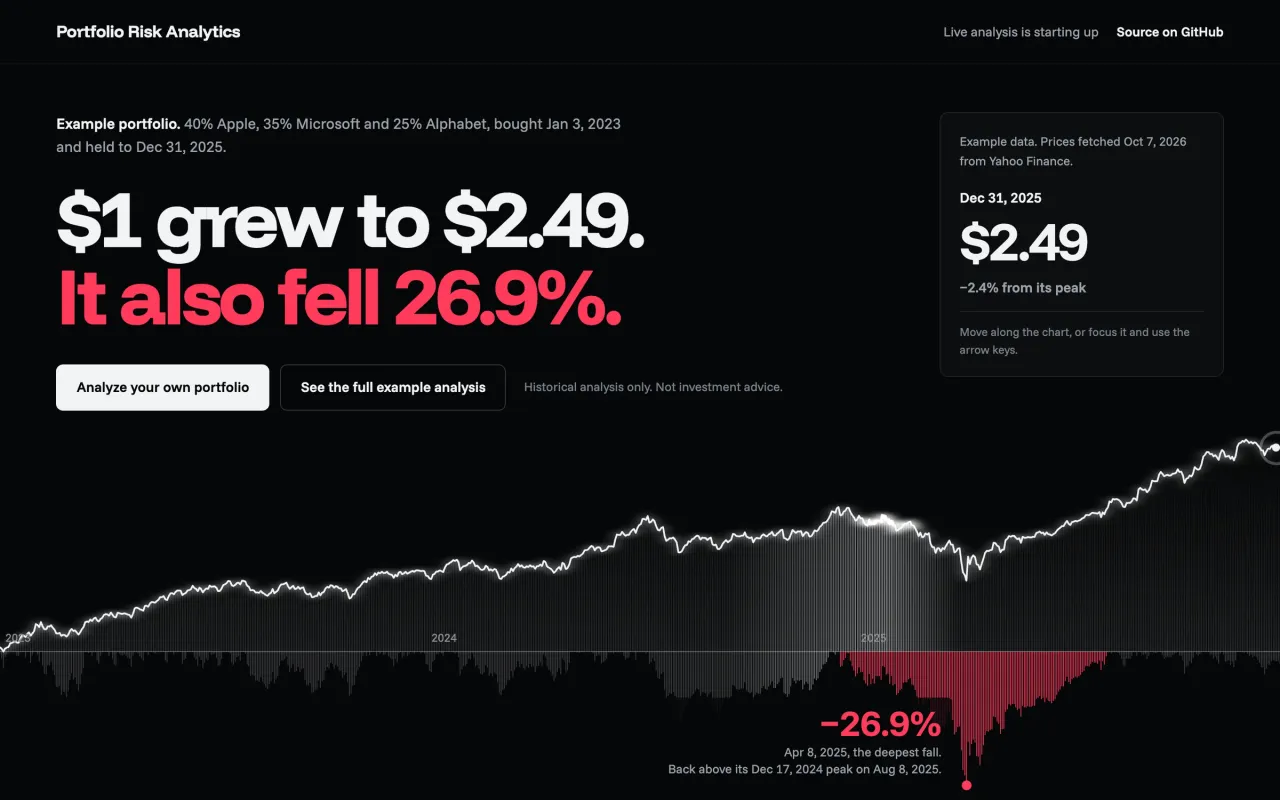
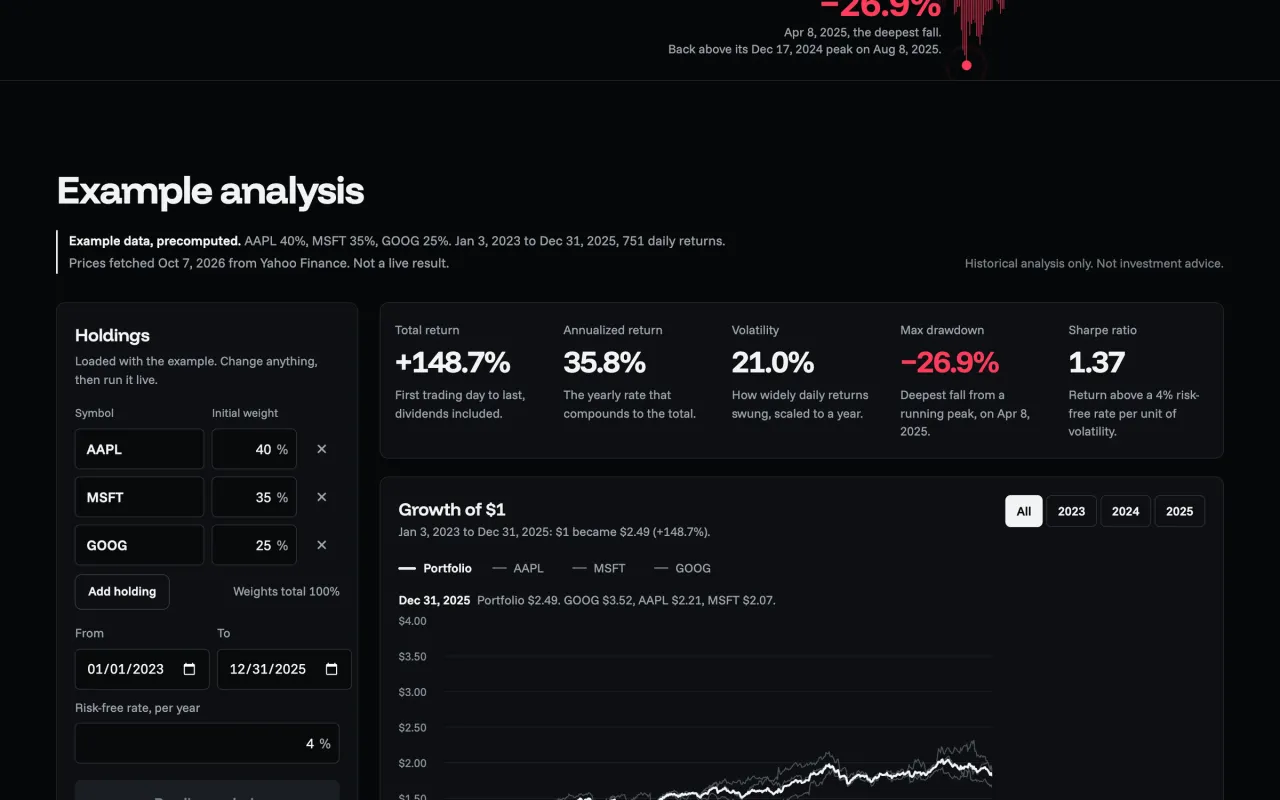
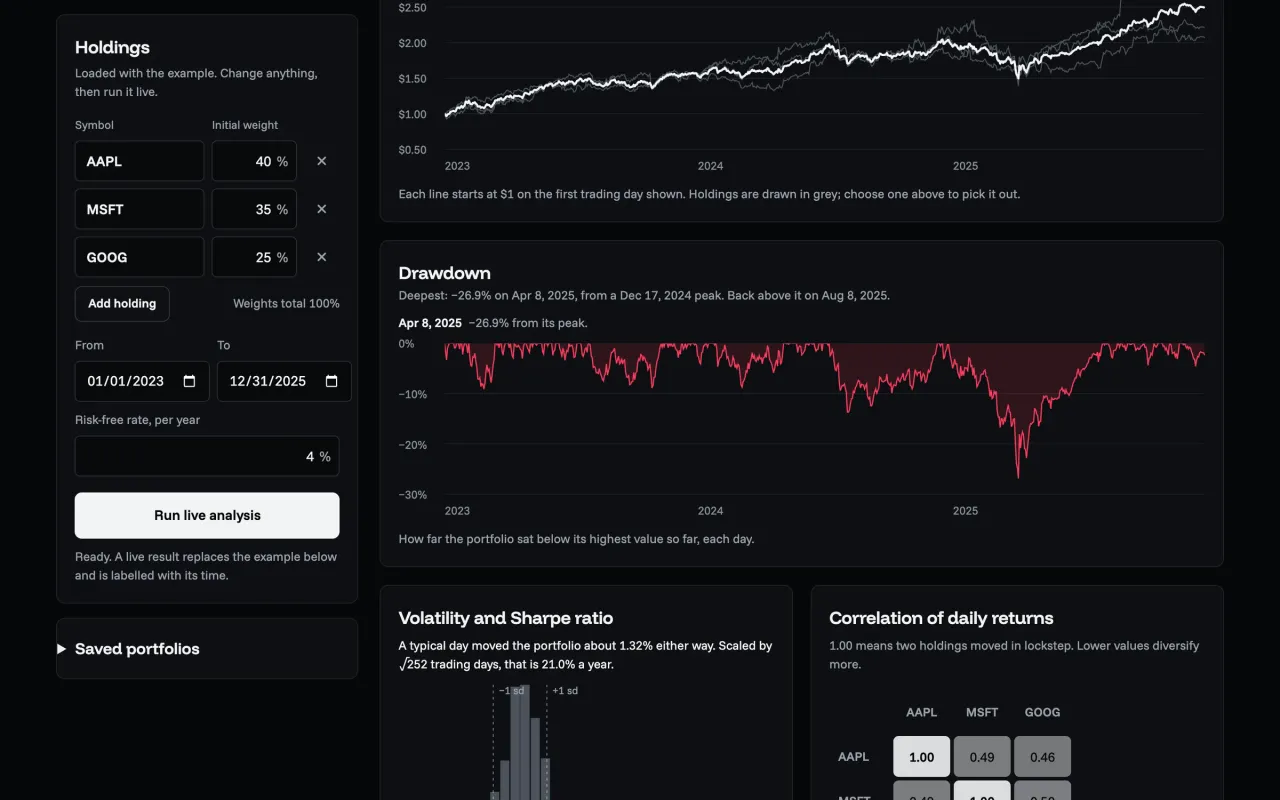
Measures a stock portfolio’s historical return, volatility, drawdown and correlations, and returns an error instead of guessing when data is missing.
Opens on a precomputed, labelled example. Historical analysis only, not investment advice.
01Problem
Portfolio risk numbers are easy to compute wrongly. Forward-filled gaps, adjusted prices mixed from different fetches, and silent rebalancing assumptions all produce figures that look confident but are wrong.
02What I built
I built a FastAPI service with pure pandas analytics, a SQLite price cache, documented endpoints with a single error format, and a dependency-free dashboard with hand-built SVG charts.
03Data flow
- Holdings + dates
- Validate (Pydantic)
- SQLite cache or Yahoo fetch
- Data-quality rules
- Pure analytics → JSON
04Decisions
Refuse to fill gaps
An interior gap returns MISSING_DATA instead of being dropped or forward-filled. Dropping the date would turn a multi-day move into one “daily” return.
Replace, don’t patch, the cache
A refresh replaces a symbol’s whole cached history, because adjusted closes change retroactively after splits and dividends.
05Validation
- Offline tests use deterministic price fixtures and dependency overrides. One test pins buy-and-hold against daily rebalancing.
- JavaScript tests check that the page’s own calculations reproduce the API’s volatility and drawdown dates.
06Limits
There is no trading calendar, so a date missing for every asset looks like a holiday. Yahoo Finance is unofficial and can rate-limit requests. Annualizing with √252 is an approximation.