03 · Data · Public health
SHS Campus Health Dashboard
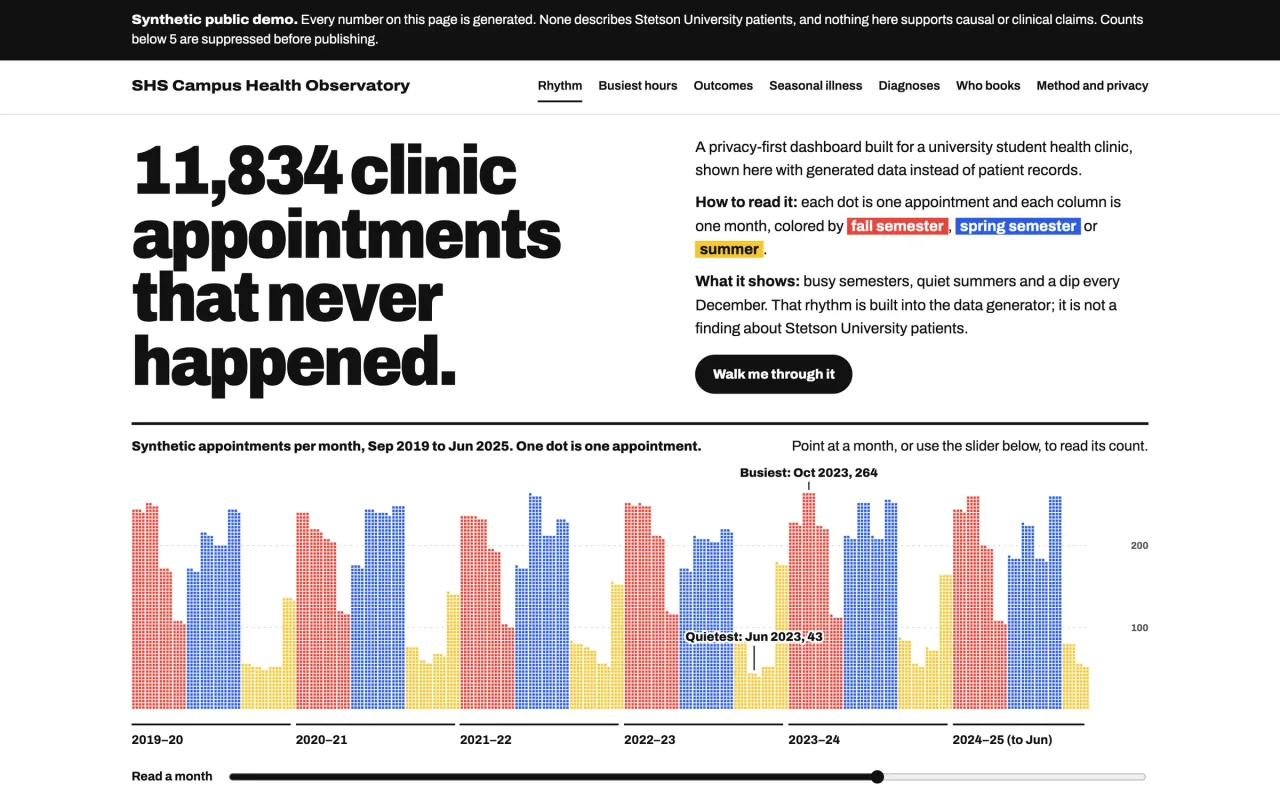
Turns years of inconsistent clinic spreadsheet exports into privacy-safe reporting. The public version runs entirely on synthetic data.
Synthetic public demo. No real patient records are included or described.
01Problem
During my Stetson Health Services internship, clinic reporting depended on raw multi-year Excel exports. The years did not share a schema: dates, diagnosis fields and demographic headers all changed.
02What I built
I worked with clinic staff to define what privacy-conscious reporting should show. I then built a pandas pipeline that normalizes every export into one model, plus a self-contained dashboard. Clinic staff used it to review data that had only been available as raw spreadsheet exports. The public repository rebuilds the whole thing from deterministic synthetic inputs.
03Data flow
- Excel exports (synthetic in public)
- Normalize, drop PII fields
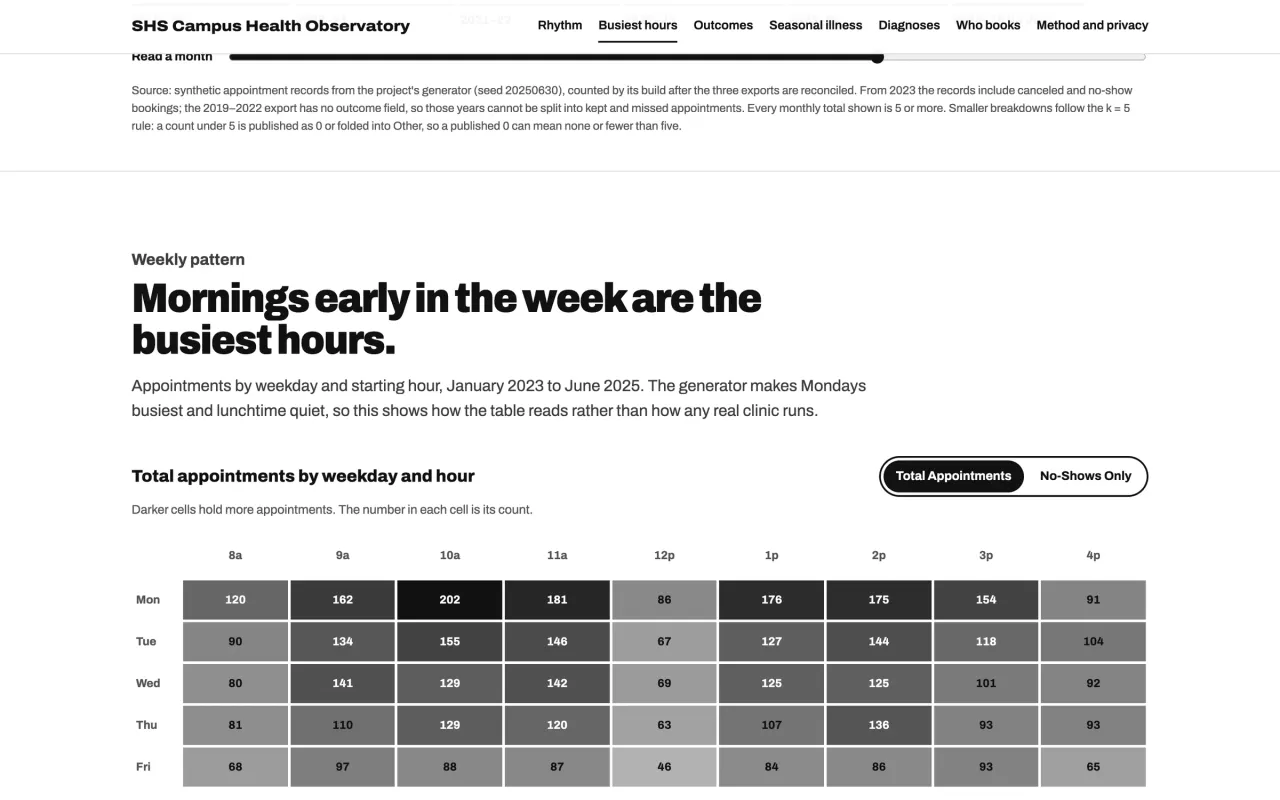
- Aggregate, suppress counts under 5
- Privacy and schema checks
- Standalone HTML
04Decisions
One canonical model
The pipeline handles mixed date formats, diagnosis codes vs. free text, and “Gender Identity” vs. “Gender” headers explicitly, rather than assuming every year has the same columns.
Suppression you cannot reverse
Cells under five are published as zero, so a reader cannot tell a true zero from a suppressed small count. As a result, displayed subtotals may not add up to the overall total.
05Validation
- Clinic staff used the internal dashboard to review data that previously existed only as raw exports.
- Tests fail the build if the privacy threshold or output contract regresses.
- CI rebuilds the synthetic data and dashboard and checks the published page is byte-for-byte reproducible. The Pages artifact contains only the generated page and its font license.
06Limits
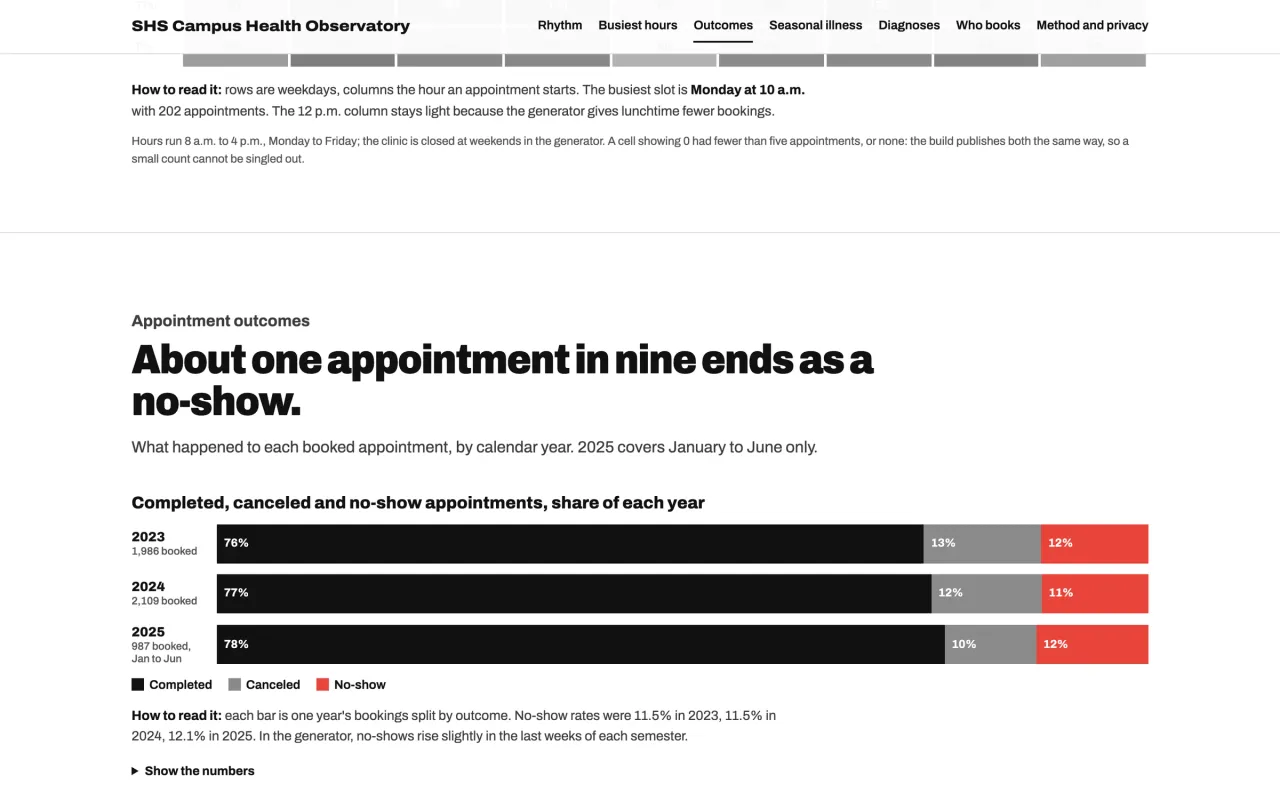
The dashboard is descriptive. It does not establish prevalence, causes or staffing needs. Records include canceled and no-show bookings from 2023 onward. Earlier exports have no status field, so those years cannot be split into kept and missed appointments.